
 The banner at the top of this page includes an interesting image, which was obtained by zooming in on a tiny portion on the border of the Mandelbrot set, which is pictured in full at left. If you do a Google Image search for Mandelbrot Set, you'll get a sense of the amazing variety of images generated by the same simple mathematical formula.
The Wikipedia entry for Mandelbrot Set might appear intimidating, but the basic concept here is simple.
All these beautiful images emerge when you iterate a simple formula and graph the results.
What does that mean?
Imagine you have a simple formula such as
A*A+B (where B is a constant)
If you assume B=2 and pick an arbitrary value for A, e.g. A=7, the equation would look like this:
A*A+B = 7*7+2 = 49+2 = 51
Iterating the equation means calculating it again using the result, 51, as A in the next go-round.
So this time, A=51 and B=2
A*A+B = 51*51+2 = 2603
Iterating it again would look like this: A*A+B = 2603*2603+2 = 6,775,611 and so on...
The Mandelbrot set is the result of a very similar mathematical recipe, involving complex numbers. You don't need to go review complex analysis to get the point that iterating a simple formula and graphing the results yields all these fantastic images.
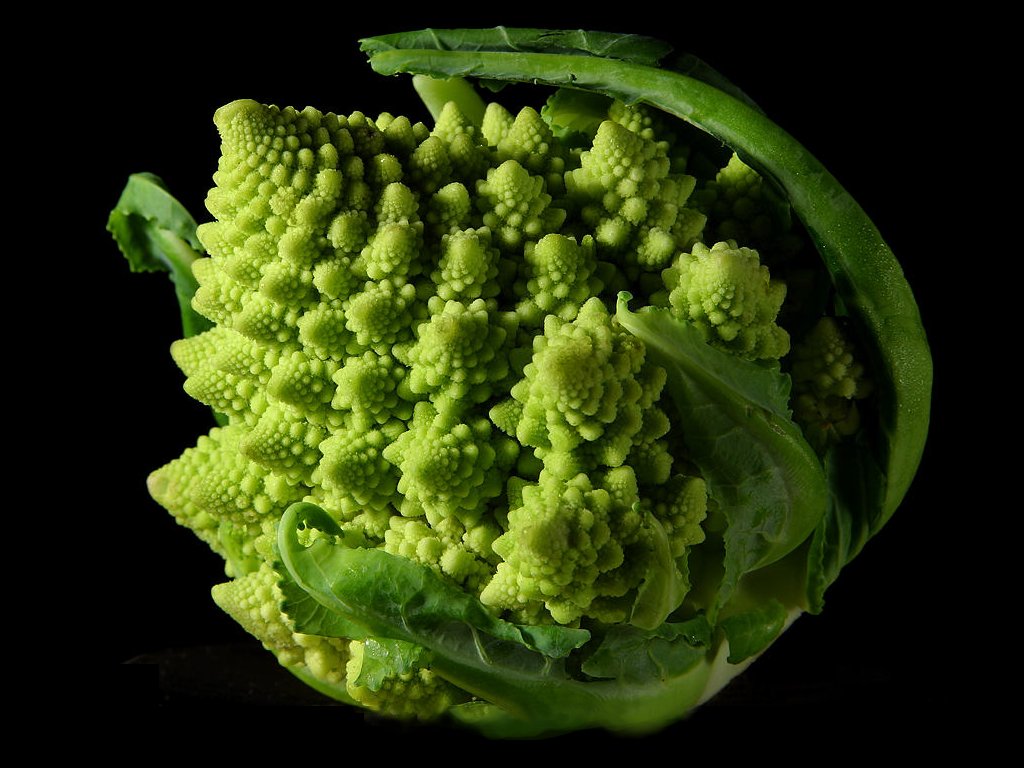
Many patterns in nature also can be accurately reproduced by iterating simple formulas. This broccoli, for example:
The recipe to produce the Mandelbrot set is slightly more complicated than the simple iteration example given above, but the basic concept of mapping a point on a graph is the same.
When complex numbers are involved, the results are graphed on the complex plane. The complex plane is analogous to the (good old) x,y plane. Complex numbers are made of two parts, a real part and an imaginary part. To represent complex numbers graphically, you need to keep track of the two parts separately. So each requires its own axis, which is easily represented as an ordinary looking two-dimensional graph, but with multiples of i plotted along the vertical axis instead of multiples of y.
So i is the imaginary unit, one step up the vertical axis on the complex plane (just as 1, the unit, is one step to the right on the horizontal (real) axis. The negative unit, -1, is one step to the left on the real axis. Rounding out the picture, we write -i one vertical step down. (See below.)
Complex numbers are written in the form
[real component] + [imaginary component]where the imaginary component is expressed as a multiple of i. For example
3 + 2iWhen you graph that, you count 3 units to the right (+3 on the real axis), and 2 units up (+2i on the imaginary axis), and plot your point. Here is a plot showing 4 different complex numbers as points on the complex plane:

The Mandelbrot set is a collection of points on the complex plane generated by a very simple algorithm (that's Math for "recipe") iterated a whole bunch of times.
The Mandelbrot set Recipe
Pick some point Z on the complex plane as your starting point. You will also need an arbitrary complex number constant, let's call it C. Following the iterative procedure described just below, we need to decide whether to color point Z black. The Mandelbrot Set is the collection of black points on the complex plane determined in this fashion.
Take another look at the collection of black points below:
Here's what you do with your starting point Z to decide whether or not to represent it with a black dot on the complex plane:
Multiply Z by itself. Add C. The answer is the new value for Z. Repeat, starting with the new Z (using the same value of C in every iteration).
Graph the result of each iteration. This generates what is called the Julia set of the point you started with. If the Julia set remains bounded, then the original point Z is colored black.
How do you know if the Julia set will remain bounded? Well, you keep iterating the function Z*Z+C until you get a value of Z that is more than 2 units away from the center. Once that happens, subsequent iterations will yield values of Z that very quickly head off towards infinity. If the values of Z head off towards infinity, then the Julia set is not bounded, which means that the point you started with is not in the Mandelbrot set, and does not get colored black.
It can take a very large number of iterations before you can be sure that a Julia set is not bounded. For practical reasons (limited computing power and time) you have to pick some cutoff point, say 5000 iterations. If you still don't know after 5000 iterations, you give up and assume that the initial point is in the Mandelbrot set, or at least very close to it, and color it black.
So that's how to determine if a point is black or not. But where do all the other colors come from?
All the points that are not black are not on the Mandelbrot set. So, we could color all non-Mandelbrot set points white. But more interesting is to color-code the non-black points according to how many iterations it took before you were sure that the Julia set was not going to remain bounded.
For example, if it took between 0 and 1000 iterations, color it red. If it was between 1001 and 2000, orange; 2001 - 3000, yellow, etc. The color choices are arbitrary, but they have meaning: they help illuminate the chaotic detail on the border of the Mandelbrot set. (The choice of black for the points on the Mandelbrot set is also arbitrary, by the way.)
[pictures / video here]
Want to explore? There are several online applets, such as this one that allow you to zoom in on the Mandelbrot set. More powerful programs are available for free or very cheap, such as Fractal eXtreme, which yield much higher resolution images.
Oh, yeah: I can't write a whole post about the Mandelbrot set without mentioning fractal geometry. The Mandelbrot set is the mother of all fractals. A fractal, roughly speaking, is a shape that is recursively constructed or self-similar, that is, a shape that appears similar at different scales of magnification. You can see self-similarity in the broccoli pictured above; each bump, magnified, looks a lot like the whole broccoli.


No comments:
Post a Comment